Flood Vulnerability Maps
Maps can increase awareness of flood hazard areas, aiding in the development of strategies to cope with and minimize vulnerability to hydrologic threats. Nearly every parcel within the project area is at risk of flood damage from river flooding and/or water carried in the flow paths.
Panels show flood water depths and flow path risk areas modeled with flows from USGS gage data for the April 15, 2018 flood event.

Flood Water Depths
Maps show parcels within the floodplain that are vulnerable to flood water inundation under both frequent and extreme flow events.
Panels show the extent of land area the flood waters cover and the maximum depth in color ranges. Depths are shown in 1-foot intervals.


Flow Path Analysis
Flow paths show where rainfall runoff accumulates and drains during storm events. Many only carry water after rainfall events and run for a short period of time. Some of the larger flow paths draining the slopes along the west side of Wainiha Valley flow year-round. Flows can undermine infrastructure and buildings, erode the landscape, and increase flood water levels on the floodplain.
Panels show detail of the flow path analysis with risk levels. Risk levels are ranked by the size of their drainage areas: Low [0.34 - 5.31 acres], Medium [5.52 - 23.77 acres], and High [23.78 – 673.53 acres]. Even low risk flow paths have the potential to lead to hazardous impacts such as landslides and debris buildups.


Flood Vulnerability
Panels show a combination of the Flood Water Depths (flood extents and depths) and Flow Path Analysis (flow paths) panels.


Other Maps
Selected maps from the Wainiha Hydrologic Vulnerability Assessment
Sea Level Rise
Climate change, and associated sea level rise, is projected to increase the impacts of flooding for floods generated under high river flow events, as well as for periods of dry flooding such as wave run-up and extreme high tides that push water inland into low lying areas. Rising sea levels will increase the depth of water and its surface elevation and the area of land flooded.
Slope and Drainage Network
Slopes in the watershed are steep throughout, with many vertical areas. The high density of the streams is due to the steepness of the watershed and the substantial rainfall. The streams drain the watershed quickly, resulting in rapid rainfall runoff response.
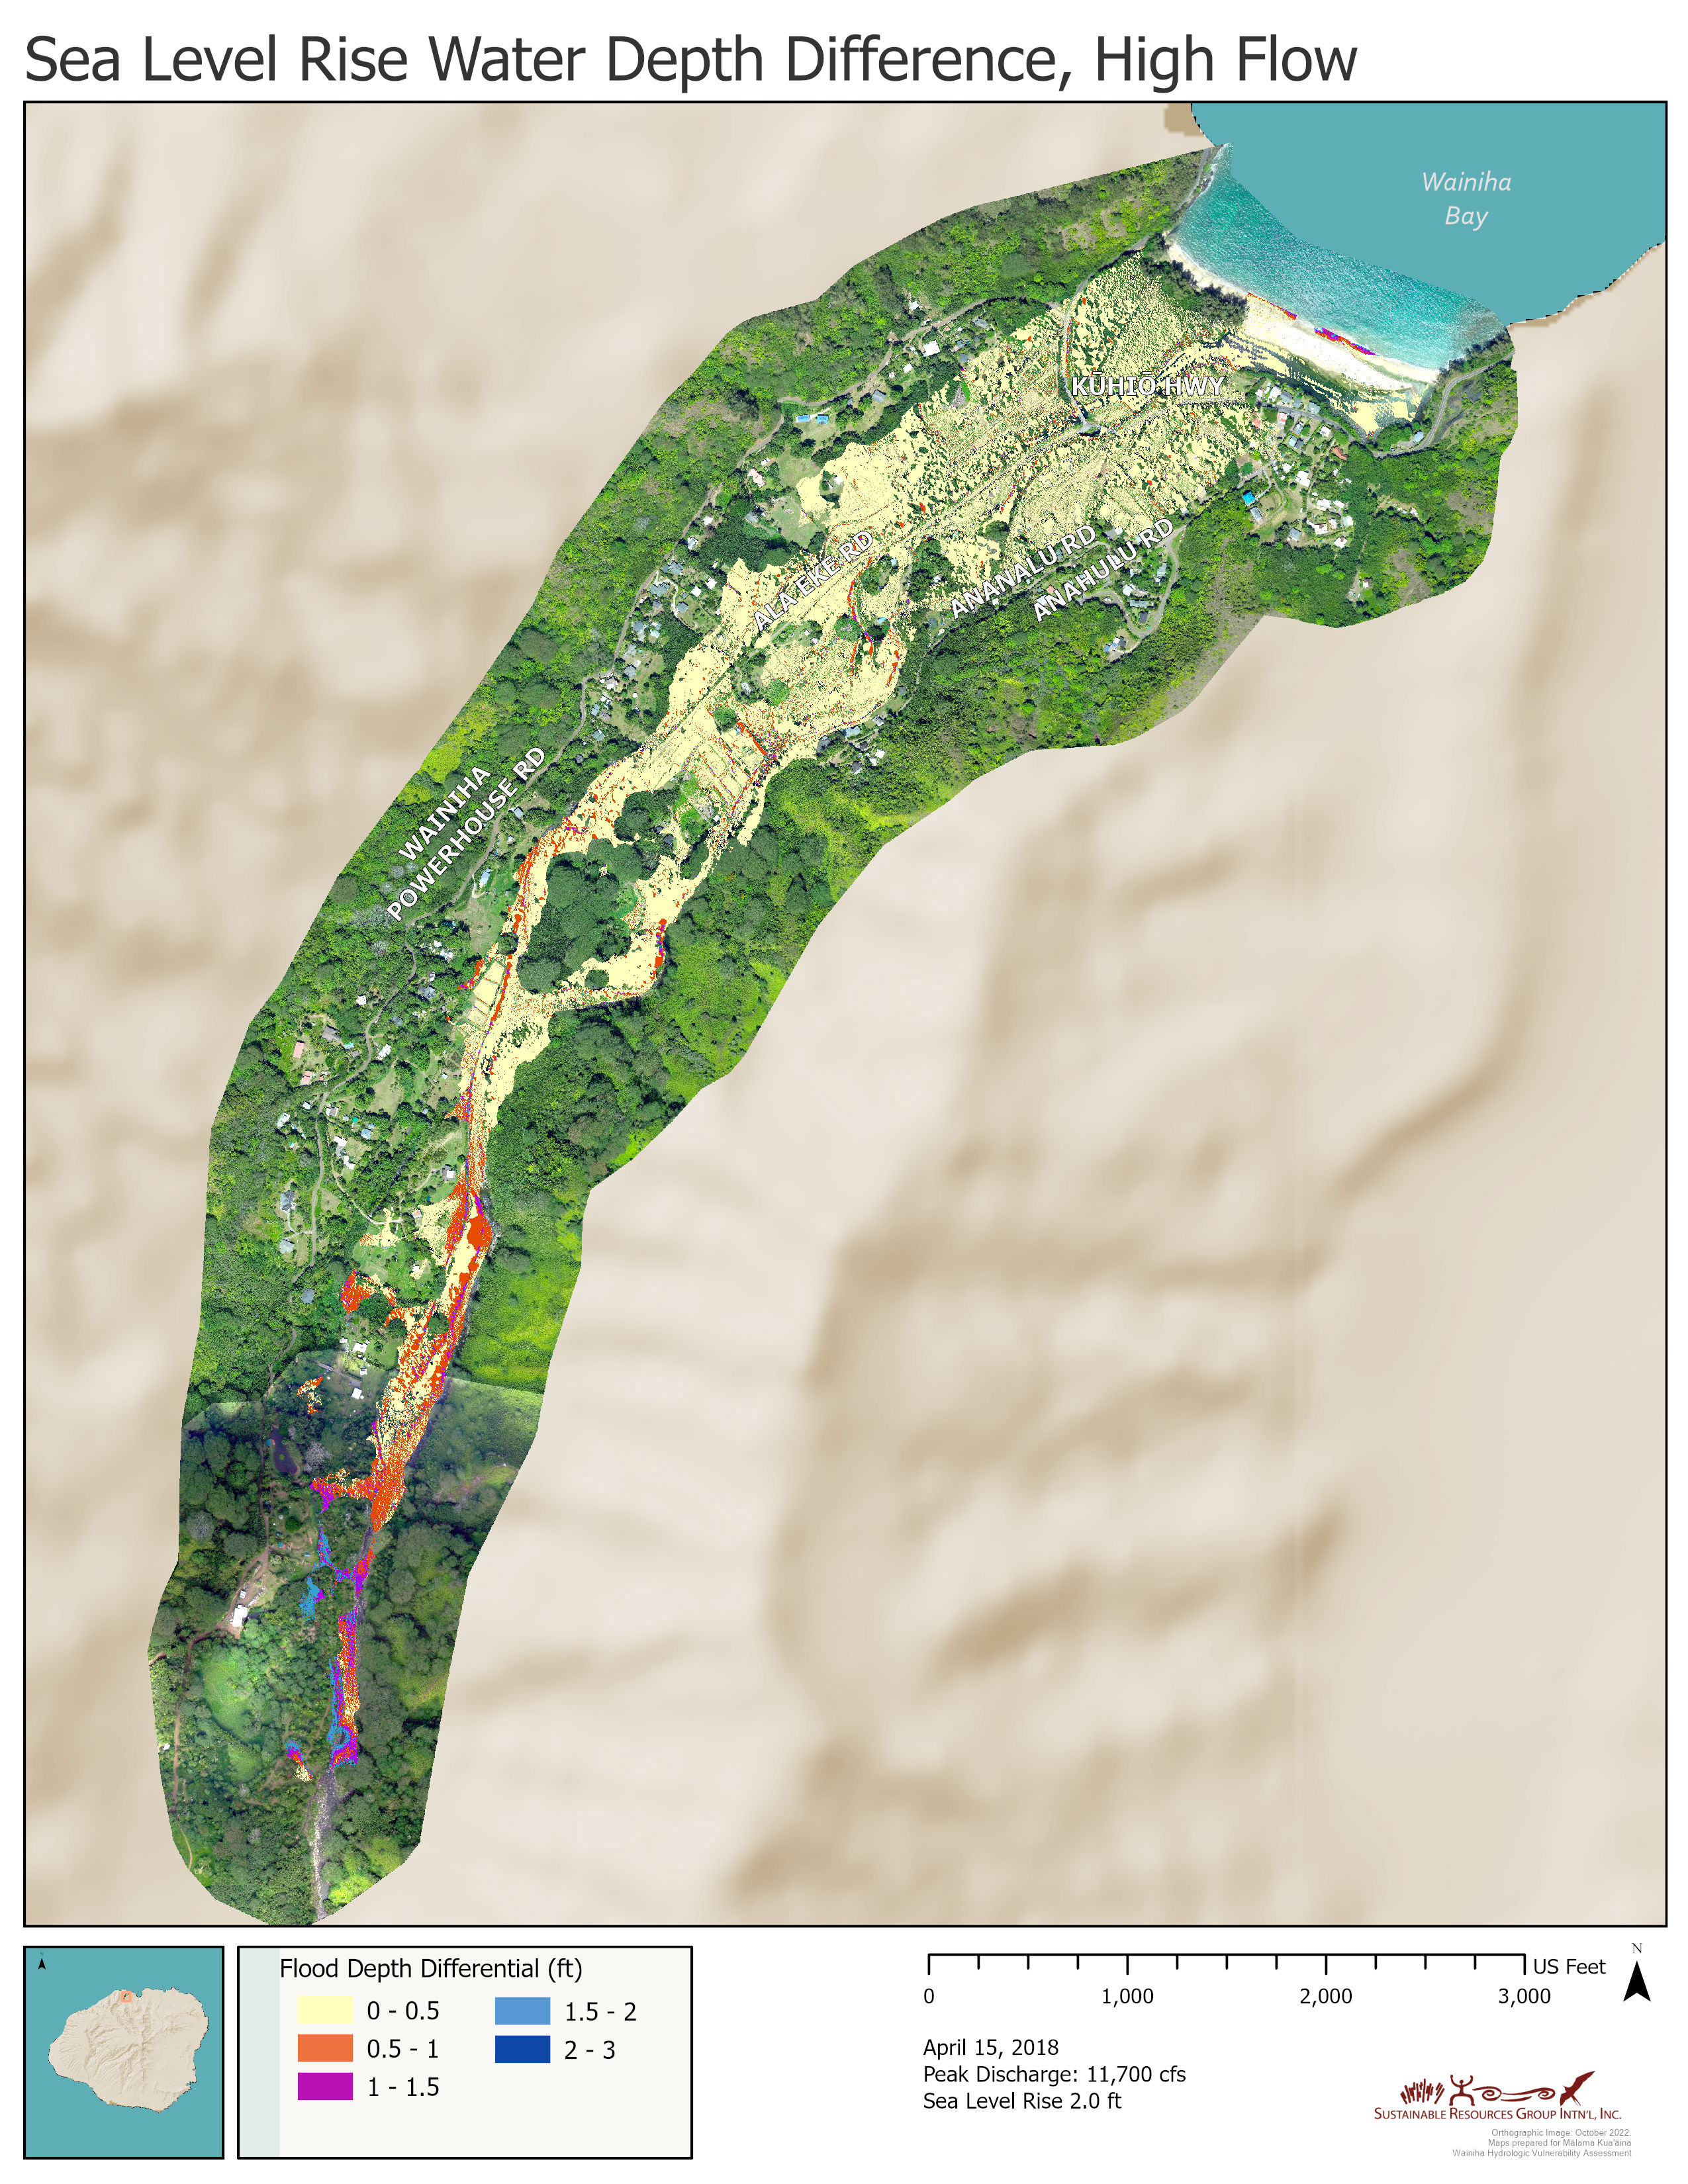
Figure shows the difference of the maximum water surface elevation estimates from the hydraulic model for the April 2018 flow events with the observed tides and with +2 ft added to the tides.
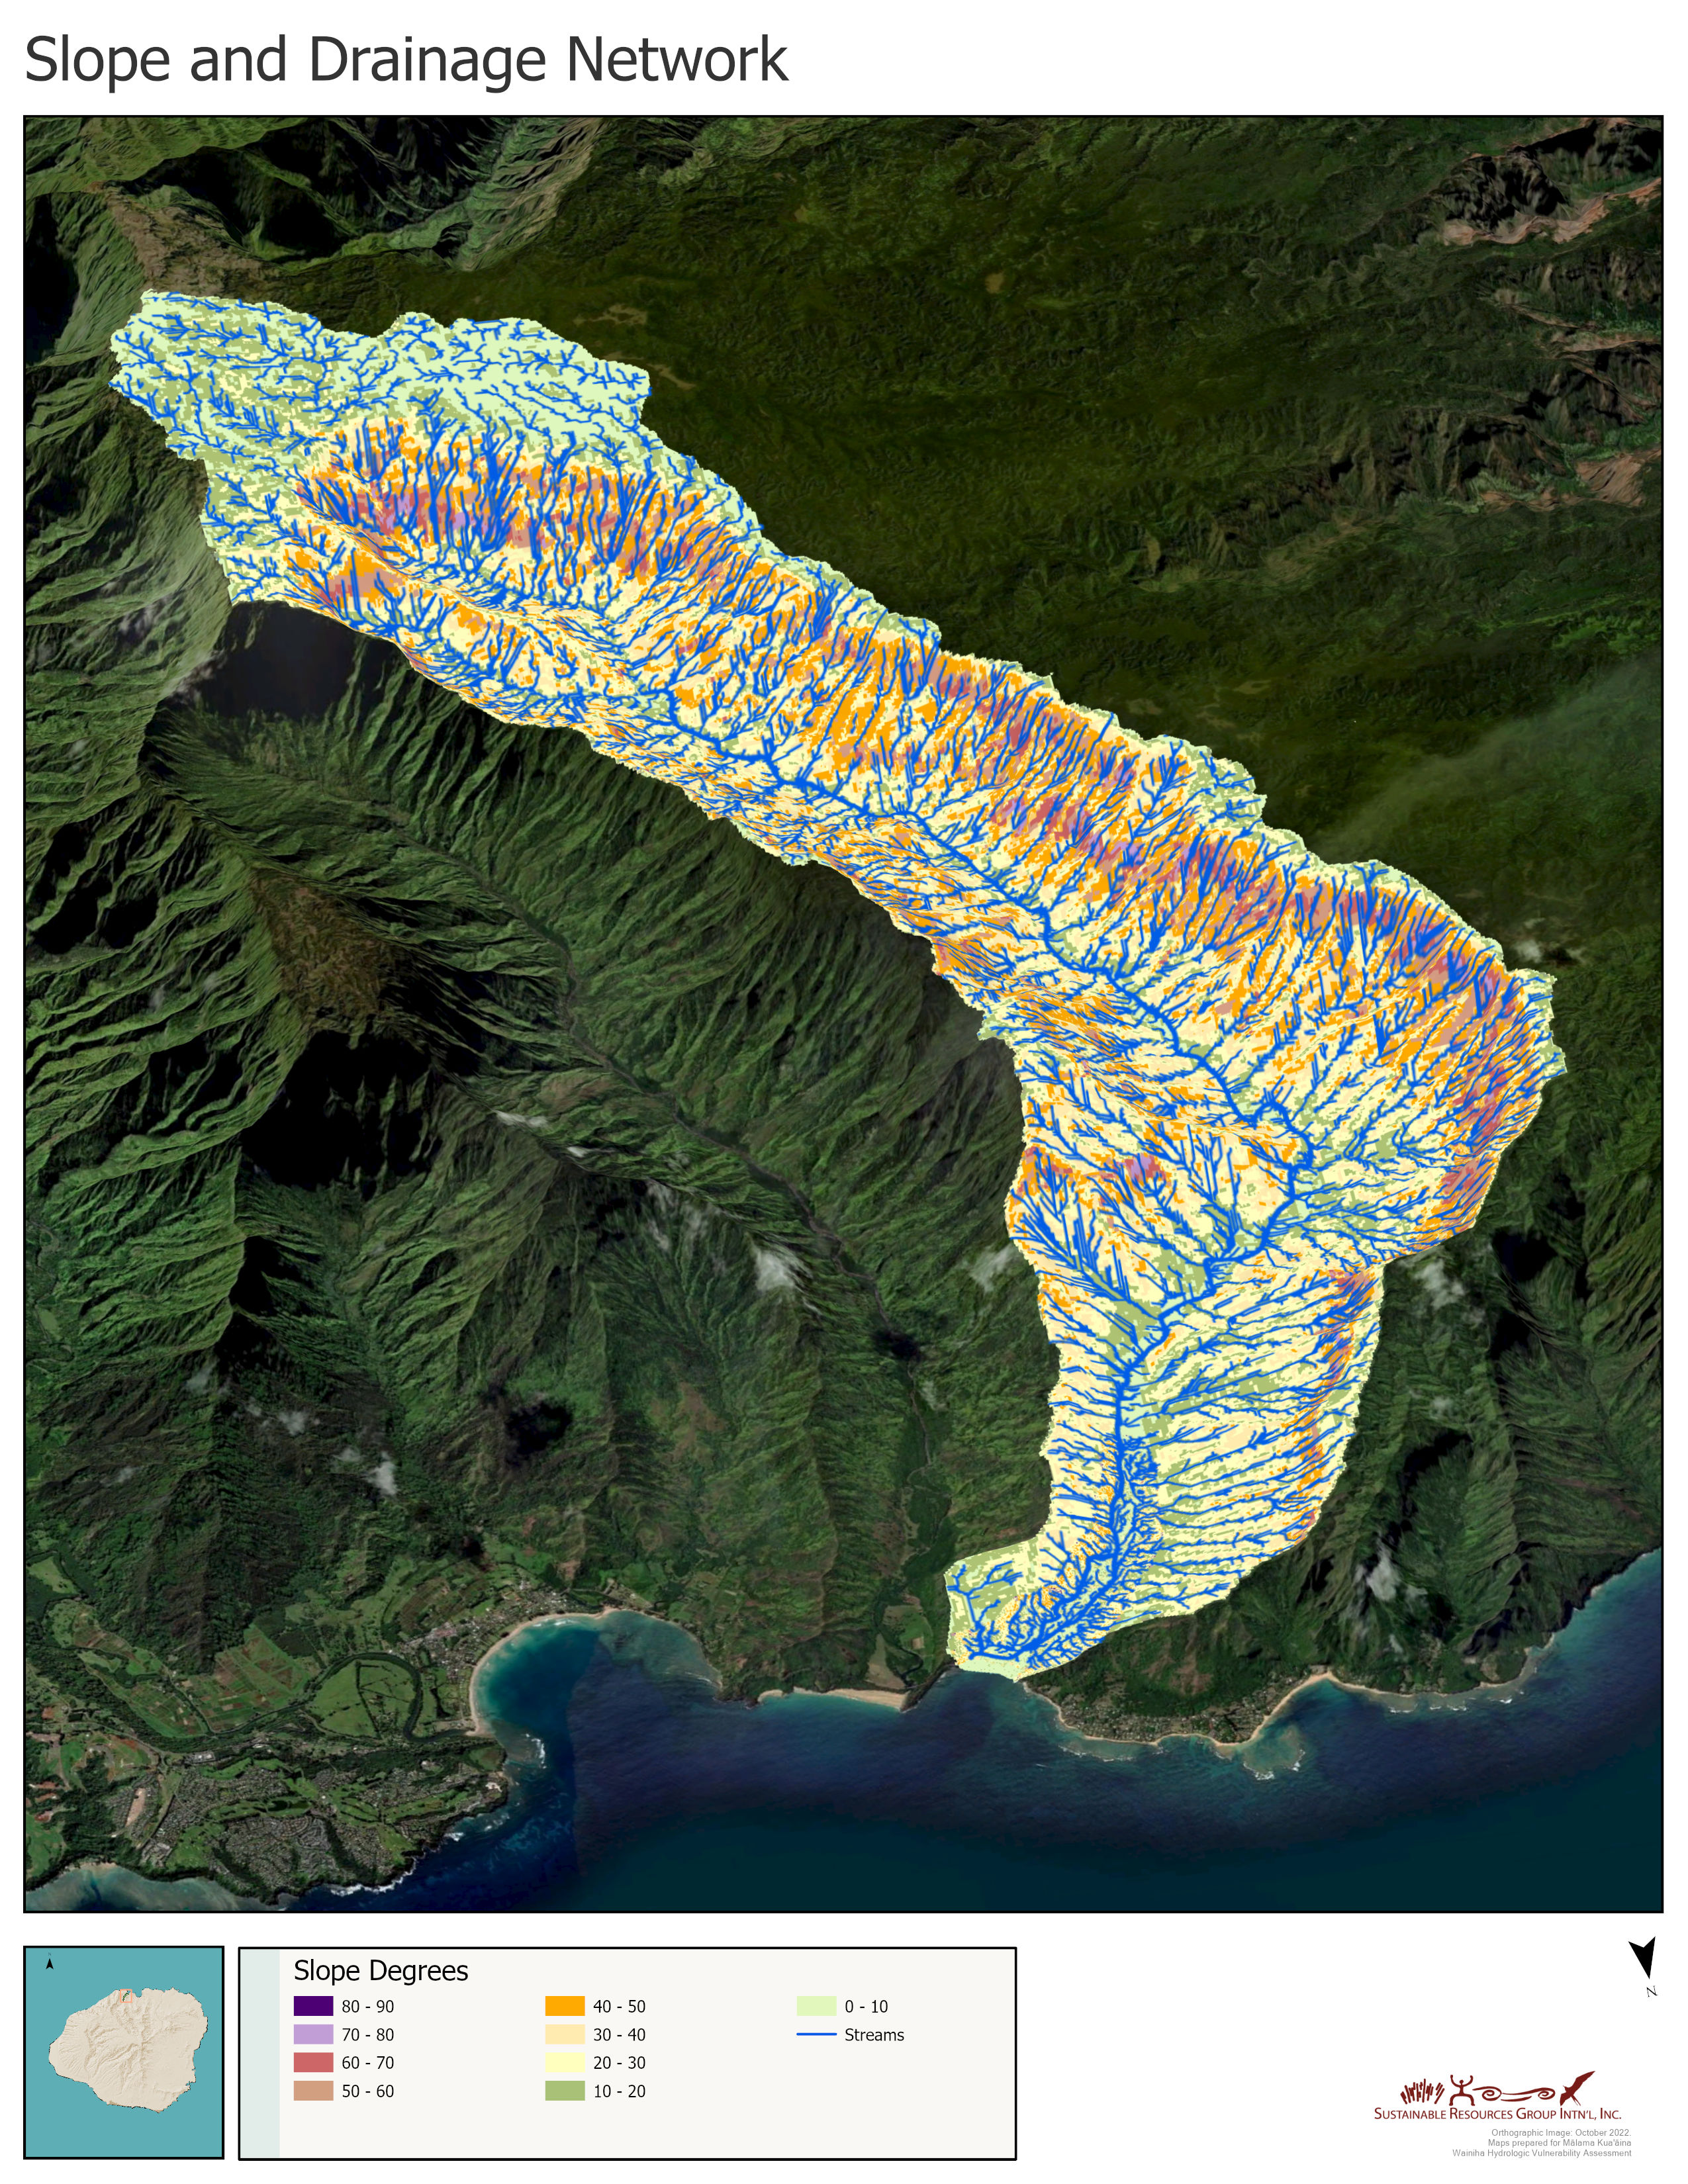
Figure shows the ground surface slopes and stream network in the watershed.
FEMA Flood Hazard Areas
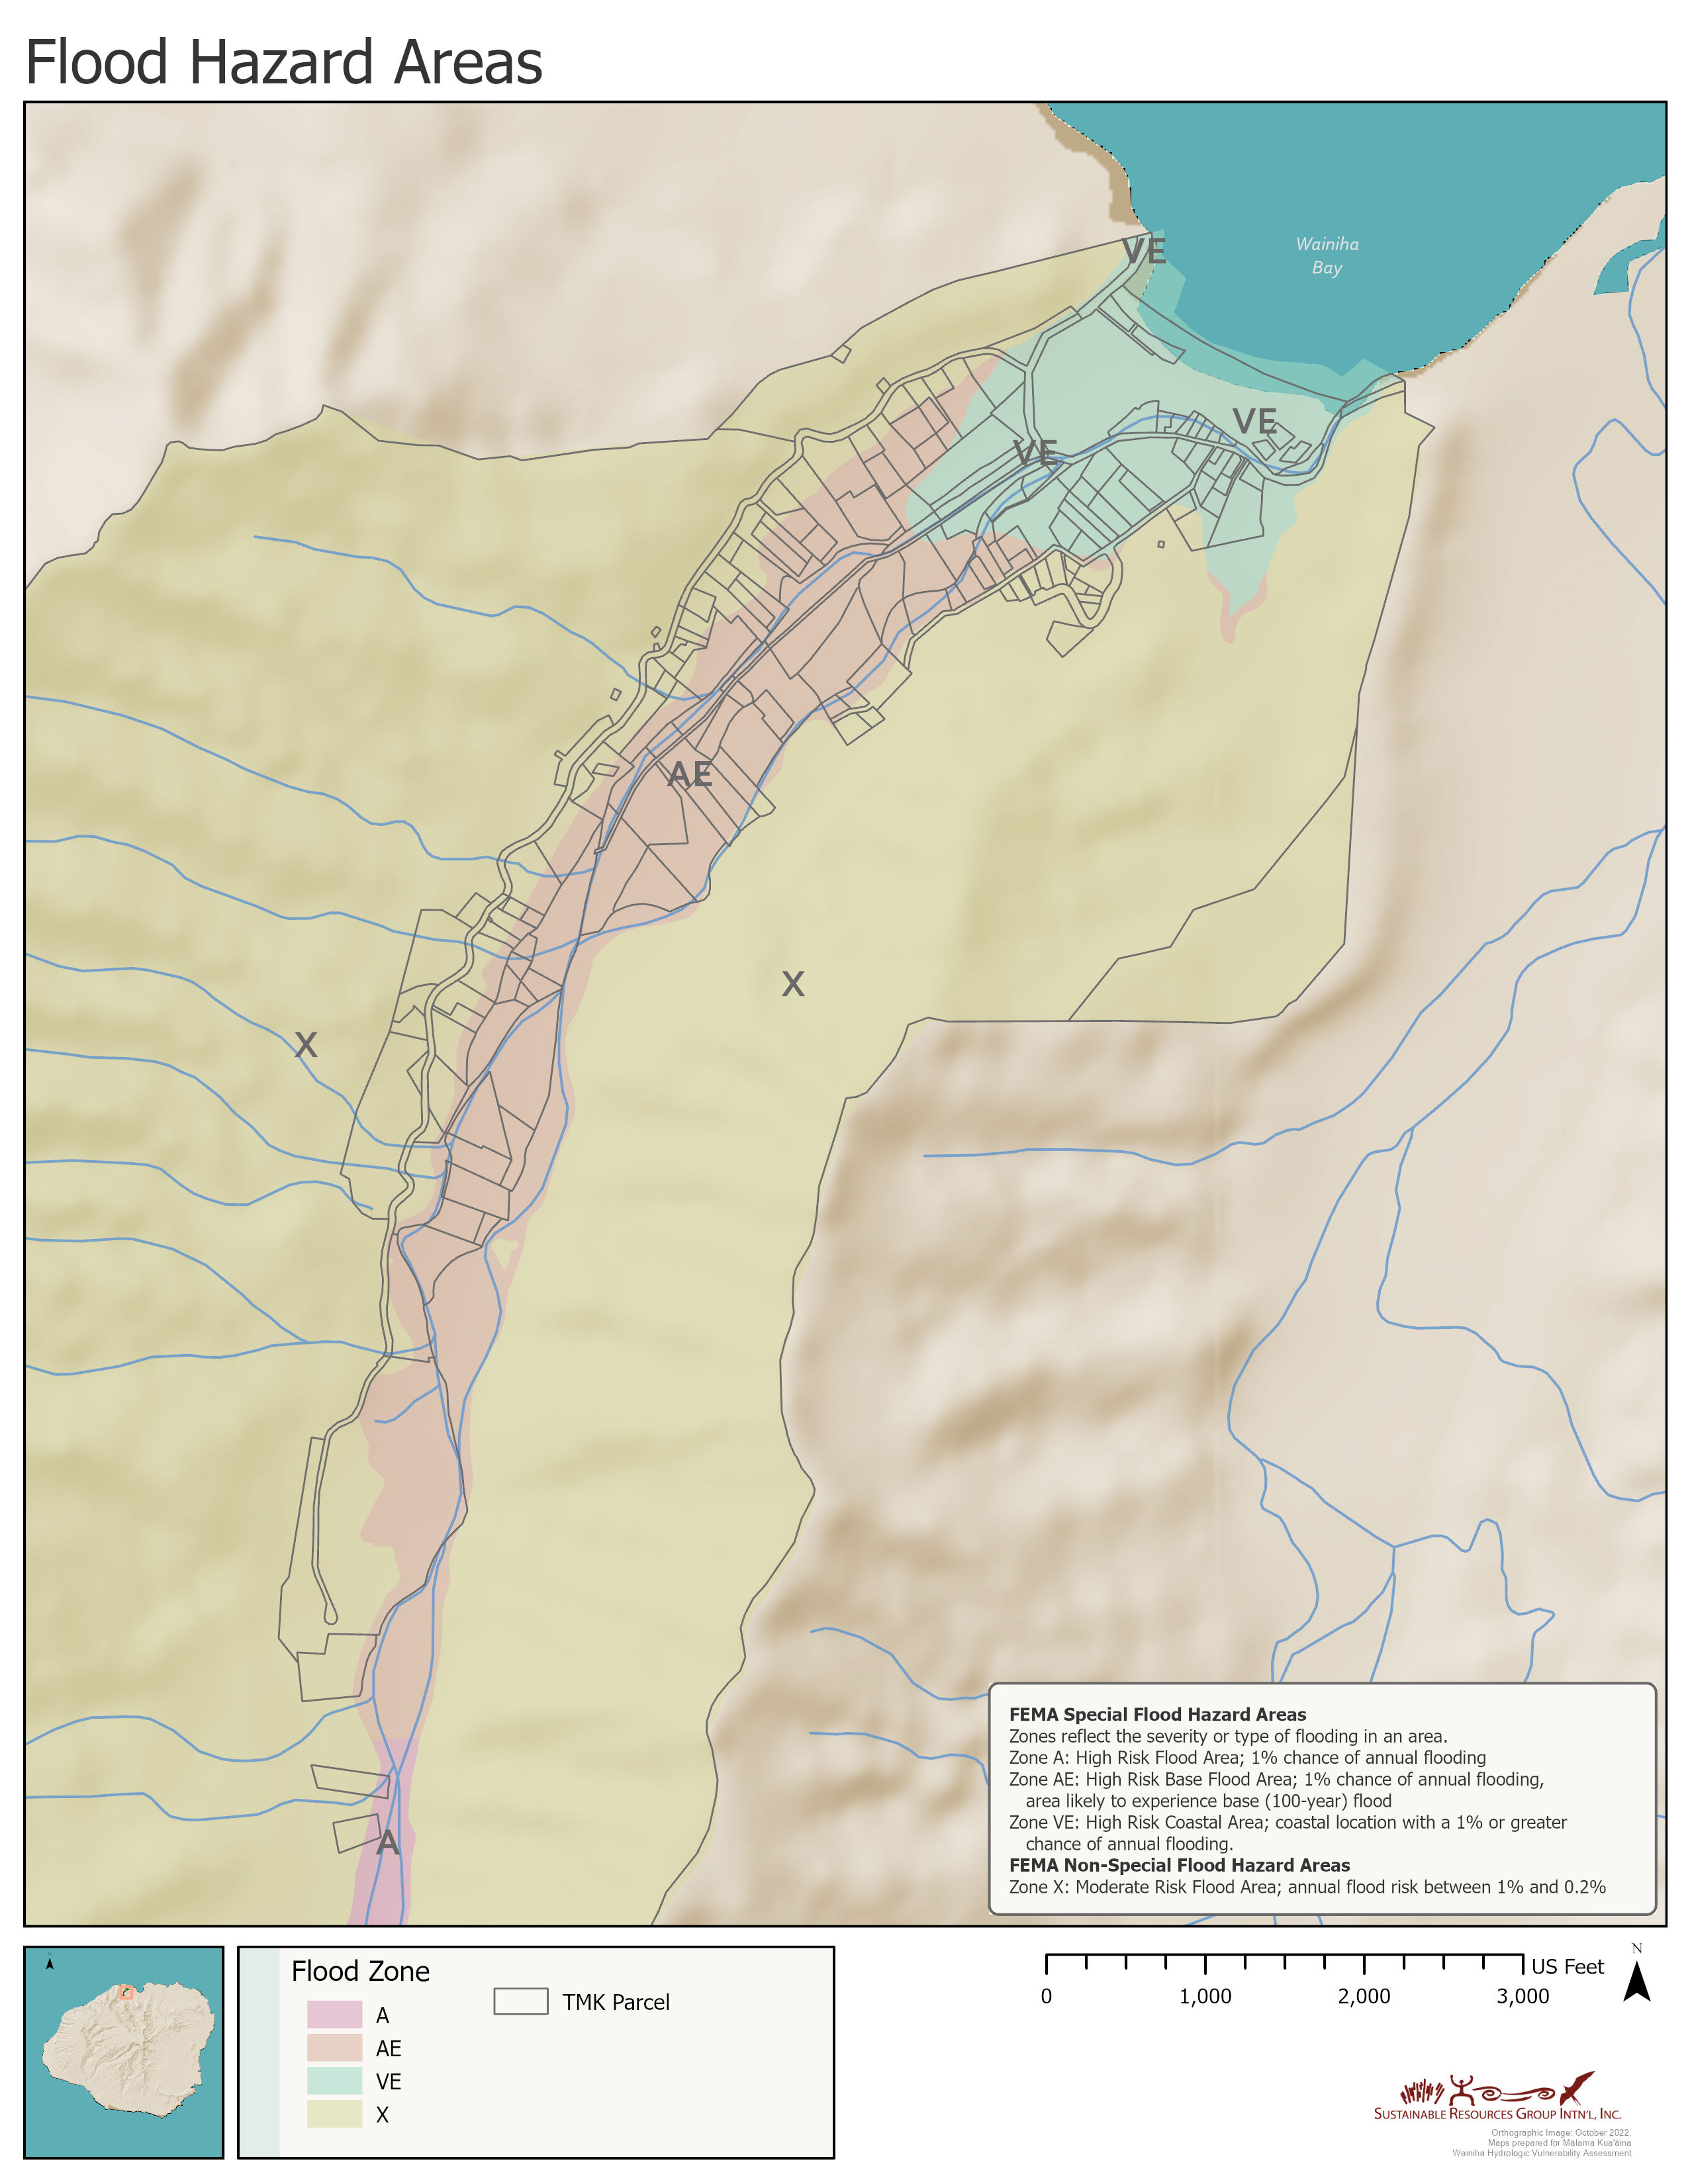
Figure shows FEMA Flood Hazard Zones within the project area overlaid with parcel boundaries. 178 of 214 parcels in the project area fall within the Special Hazard Flood Area and are high risk flood areas.
Frequent Areas of Flooding
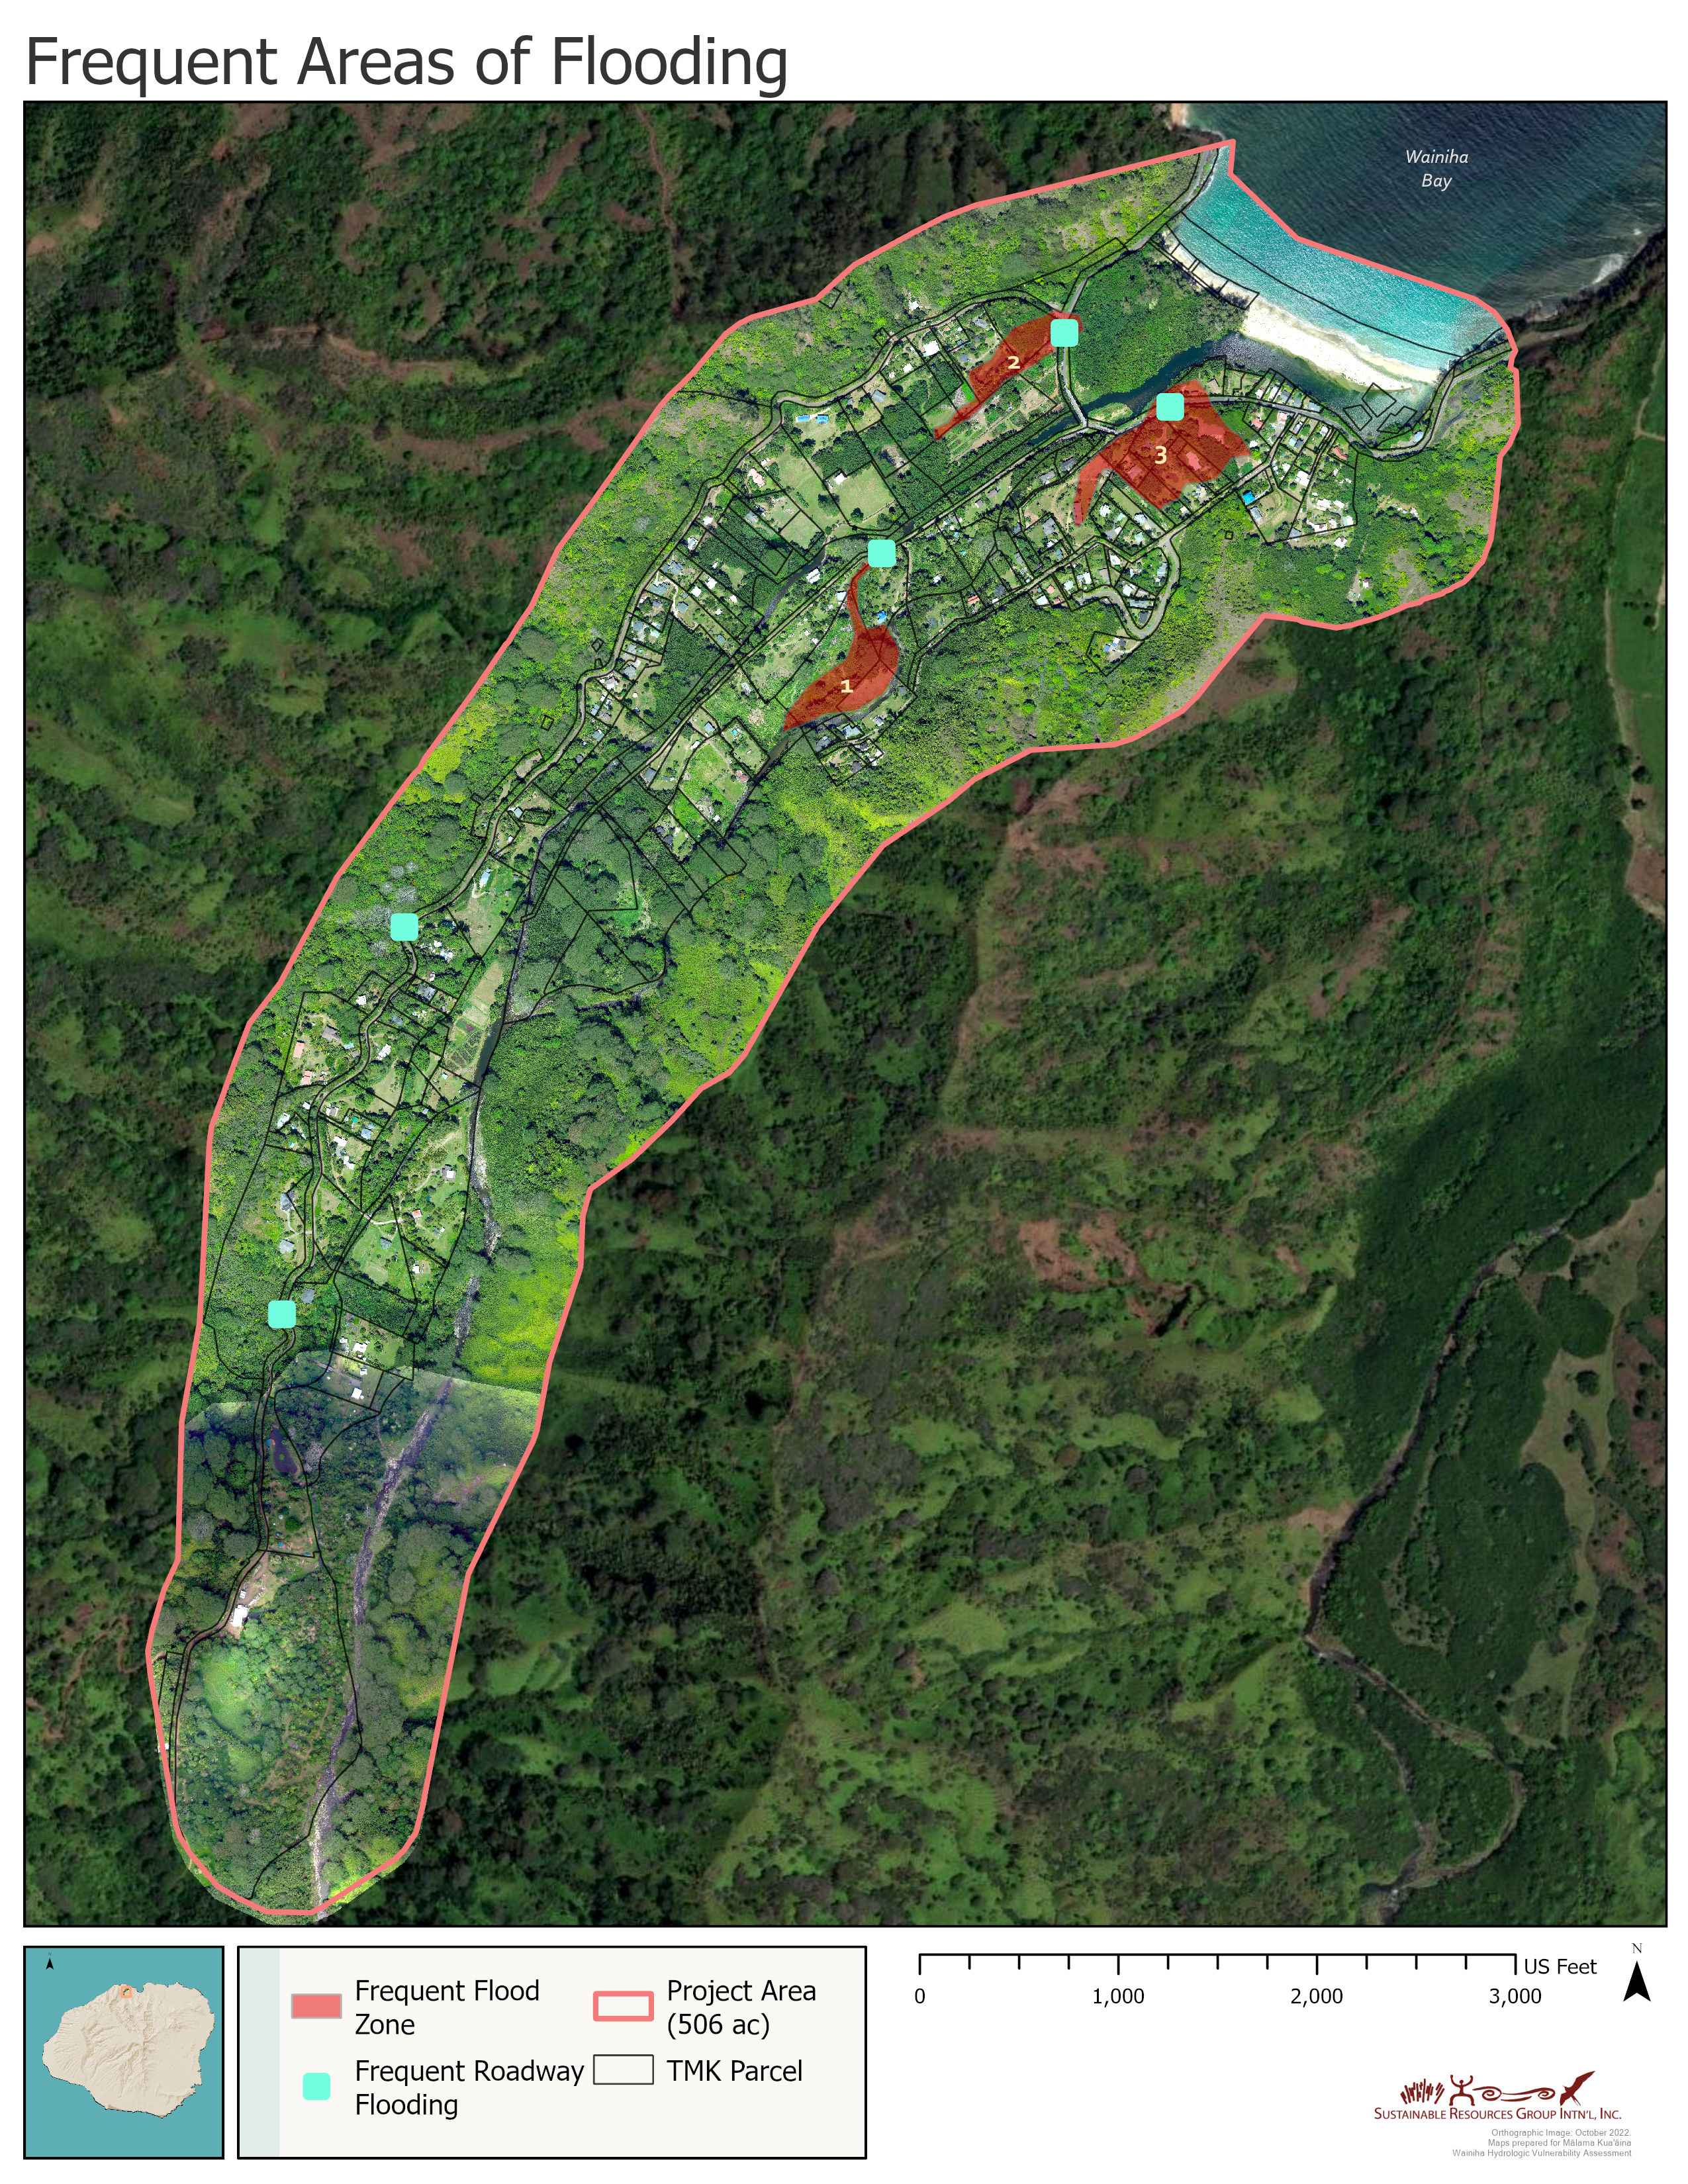
Figure depicts areas within the lower section of the Wainiha River that are at highest risk of hazardous flooding.